The problem
An Australian e-commerce business running Google Ads across multiple accounts and hundreds of products. The owner could feel the spend leaking but couldn't see where. The Google Ads UI shows everything and tells you nothing.
Every Monday morning the procurement lead spent two to three hours scrolling reports, building spreadsheets, and cross-referencing what ROAS looked like last week, this week, on this product, in this campaign. By the time anyone noticed a product had been burning budget with no conversions, it had been burning for weeks.
The decisions that came out of those mornings, lower this CPC, exclude this product, scale that one, were made by memory. There was no record of what changed or why. No way to undo a mistake. No way to tell six months later whether last quarter's reorder of campaigns helped or hurt.
The turn
Stop building another reporting dashboard. The problem isn't that the owner can't see the data. The problem is the data takes hours to read.
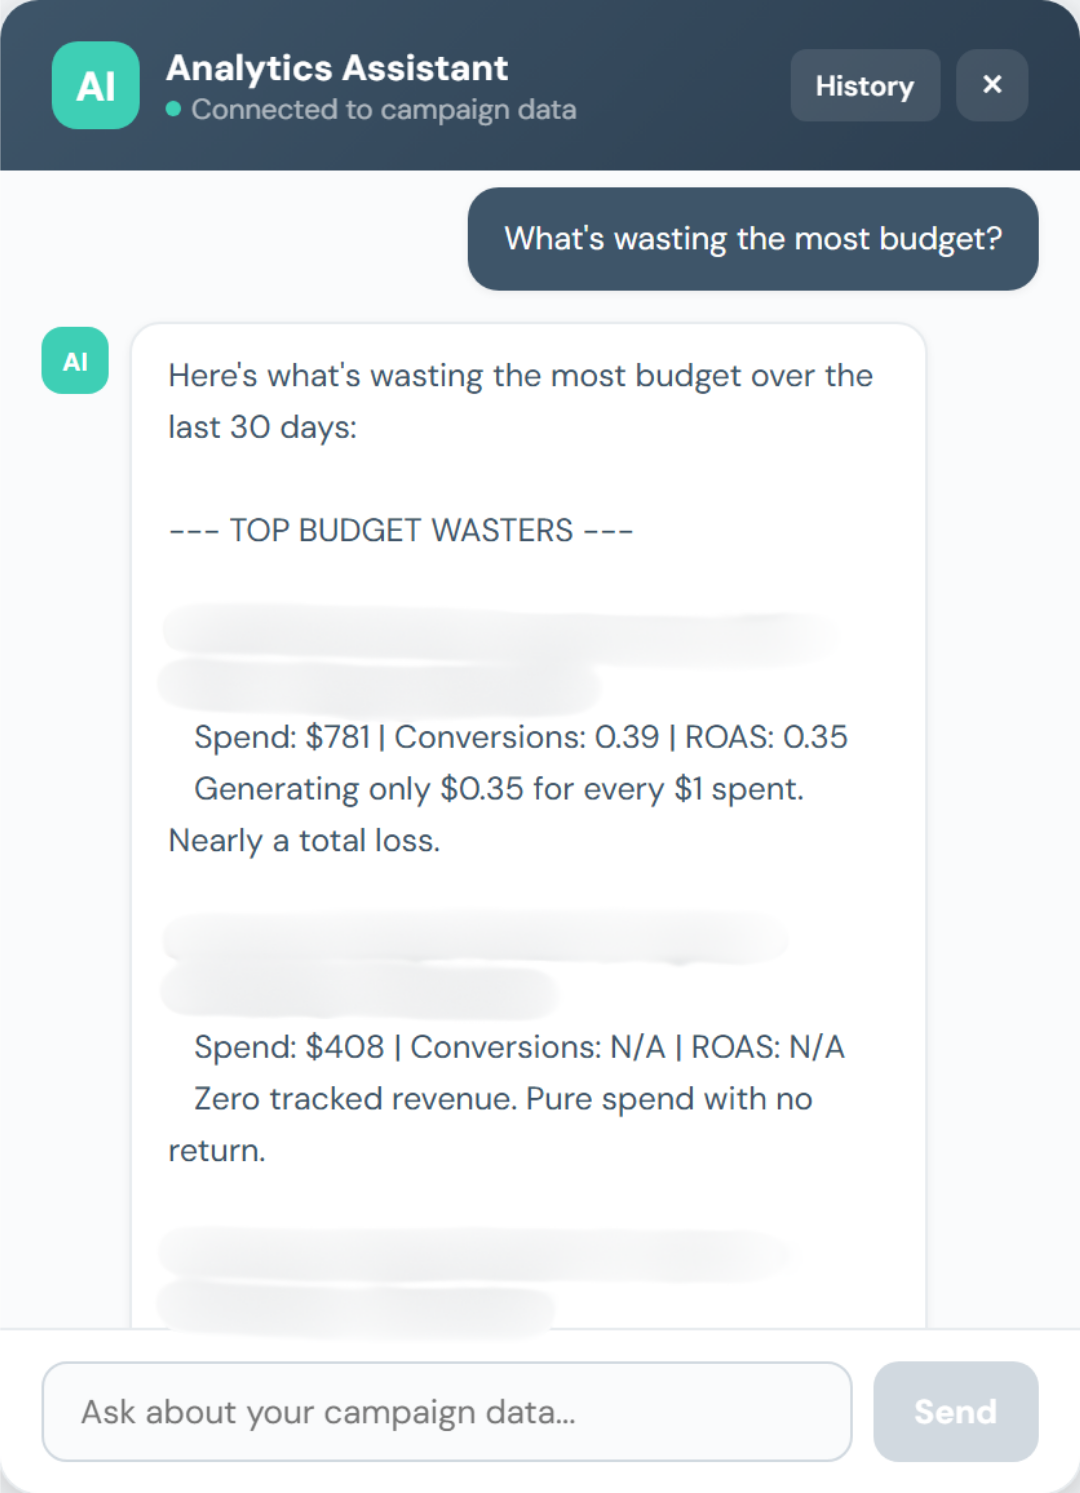
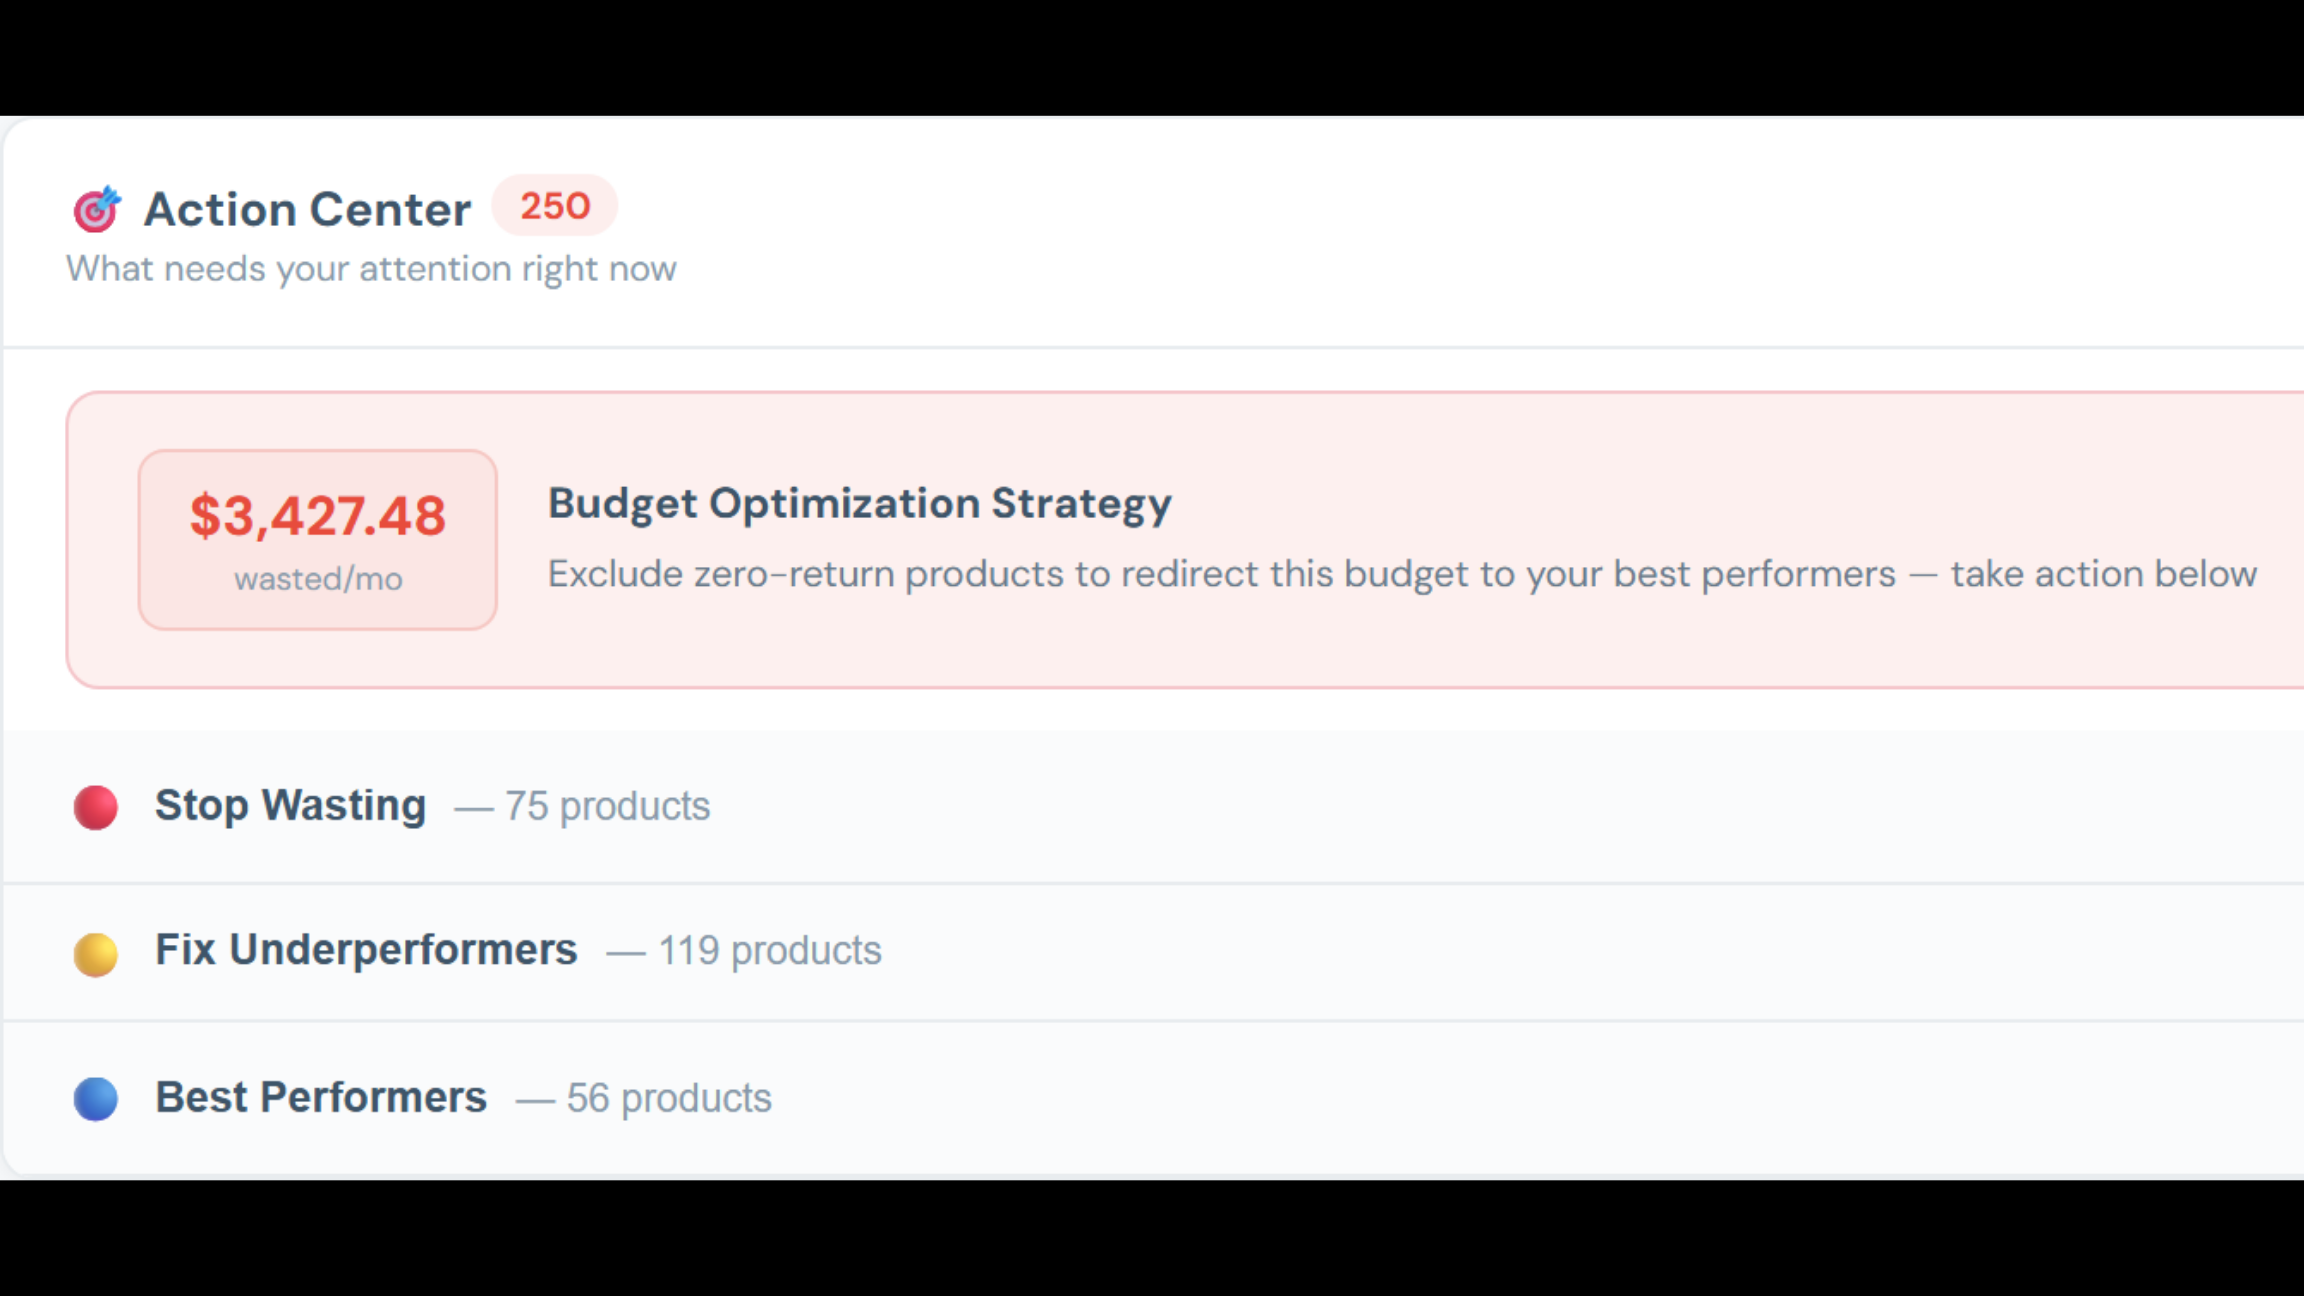
Build a system that does the reading for him. Surface what needs attention, not everything. An assistant the owner can ask "what's wasting my budget?" and get back a ranked answer with the underlying figures.
The system
A stable web stack the owner can run forever: React on the front, FastAPI and Postgres on the back, hosted on AWS, carrying a multi-agent system over Anthropic Claude on AWS Bedrock.
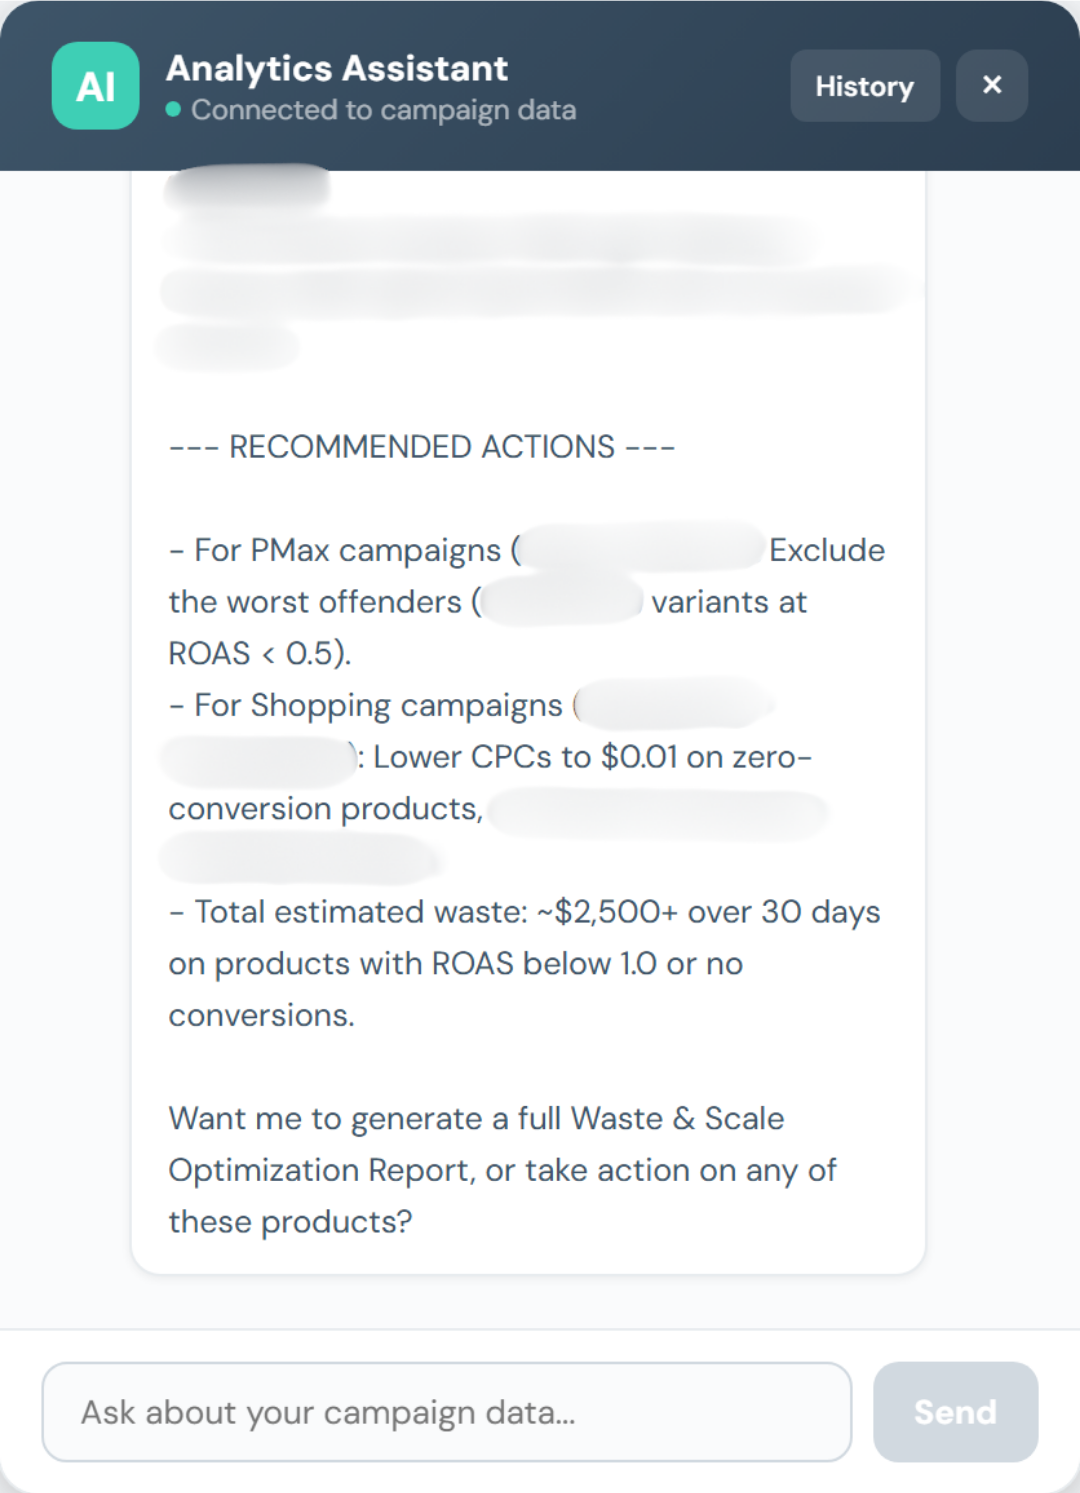
The agents read from a six-hourly snapshot of every campaign. When the owner asks a question, they fan out across the relevant data, assemble the answer in plain English, and cite the rows they used. The owner can argue with the answer because the working is shown.
Every spend-affecting action waits for the owner to say yes. Behind every "yes", the system records a snapshot of what changed. If something looks wrong twenty hours later, the action can be reversed in one click. The system also refuses to act on conversion data that's too thin to draw a conclusion from, so the noisy small-batch products don't get touched until there's real signal.
Bilingual English and Chinese UI from day one because the team operates in both.
Status
In production. Owner uses it daily. Identifies $3,000-4,000 of avoidable monthly waste within the first 30 days of deployment.